Metrics that Matter to Product Managers
What are the metrics that matter to your product?
As Product Managers, opening up Google Analytics and being confronted by the all options available can be a little daunting at first. But after a few tweaks here and there and a little trial error, we eventually get it. We set up our little dashboards which show the metrics we think are important and then we feel good about ourselves. Like you’ve achieved something meaningful.
 You haven’t.
A graph, a set of numbers, a dashboard and a couple of intelligent sounding acronyms like CPA, LTV and AOV will make any idiot appear smarter.
‘Our LTV is $50 and our AOV has declined 25% YOY but has been offset by a reduction in CPA’
‘Woah. This guy knows his/her shit.’
Really?
Humans naturally equate numbers, graphs and percentages with intelligence.
If you want to use metrics to further your career, make yourself look intelligent to your peers or bamboozle other people in a meeting room then go for it. The inconvenient truth is that in many cases, particularly in larger corporates, creating a veneer of intelligence by using graphs and charts will work wonders to further your own personal ends. What it won’t do, however, is help you create a successful product.
The inherent value of product metrics is in discovery;
- Discovering you’re not making enough money to sustain your product beyond 6 months
- Discovering that your customers are not willing to recommend your product because your refund policy is too aggressive
- Discovering that your public API is bringing in more revenue than your display advertising
These little nuggets of gold can transform the direction, focus and fortunes of a product. To discover these nuggets, you need to ask interesting questions and know which metrics you should be measuring.
I can’t ask interesting questions for you or your product. I can’t tell you which metrics matter most for your product or business model. But what I can do is provide you with a (hopefully!) useful list of metrics by product vertical which you can use for your product.
And so that’s what this post is. A list of metrics by product type which you can use to inspire your own dashboards so that you can look smart and discover things which matter most about your product at the same time – a wonderful combination for any product manager.
Here’s a list of the product categories we’ll cover.
- General product metrics
- Ecommerce
- Content sites
- API products
- Subscription products
- Mobile apps
- Lead generation sites
1. General Product metrics
Let’s start with a few general product metrics as a foundation. These are not necessarily specific to any one particular product category but they are metrics and concepts that you should be familiar with as a Product Manager if someone casually drops them into conversation.
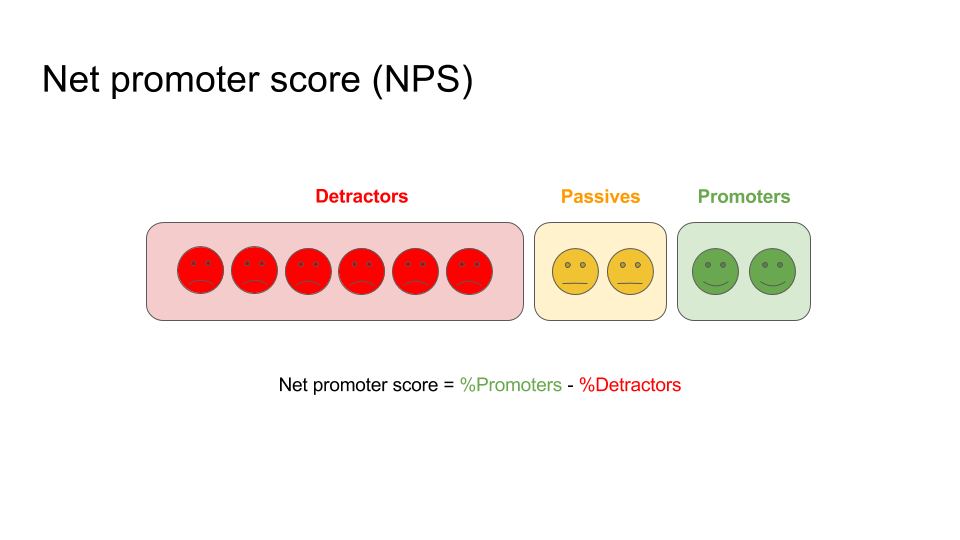
- NPS – Net promoter score using the question ‘How likely are you to recommend [your product] to a friend? 0-10’. Promoters (9-10) and detractors (0-6). Subtract the detractors from the promoters as a %. Common mistake: Your NPS is not a % itself; it’s a whole number based upon the calculation of the 2 percentages.
The NPS is generally seen as an overall indicator of how happy your customers are with your product. Revisit it on a monthly or quarterly basis. When a user gives you a low score ask why. Use the feedback to improve your product. - Revenue-The amount of revenue generated by your product directly or by your overall business. Measure the direct impact of your product decisions on the bottom line. More difficult in larger organisations but easy in startups
- Actions– actions that are specific to your product, over a set time period Your product will probably allow users to perform an action of sort. Your action will be linked to the inherent value your product is offering to its audience. For example, if your product allows customers to book cinema tickets, number of cinema tickets booked would be an action. If it allows merchants to print labels for ecommerce orders, your action would be labels printed.
- Magic metric – A metric that matters most to your product goals. A magic metric which, through your own analysis, has proven to have an impact on some of your most important product goals, such as increasing revenue, sales or NPS. Your magic metric will be unique to your product. It may take some experimentation to identify what yours is. For example, a music product may find that after 3 song previews are played the user is more likely to buy a track and recommend the service to a friend. A content publisher may find after 10 articles are viewed a month for 2 months, the user is more likely to buy a subscription. A language learning product may discover that after 3 live classes with a teacher, the student is more likely to stay for 6 months but after 0 live classes they want to cancel their subscription. Experiment to identify your magic metric and craft your product to help users experience the magic moment. Re-evaluate your magic metric every quarter to see if the correlation is still true. As your product evolves your magic metric may lose its magic over time.
- Monthly recurring revenue (MRR) – The amount of revenue generated per month. Every business should be tracking monthly revenue. Splice it by all sorts of dimensions (numbers of staff, package) to uncover the financial health of your business.
Useful for startups to measure the viability of their business or project the runway - Churn – The % of customers who stop using your product (typically per month). Critical for monthly subscription products and an overall indicator of product health.
- Cost per acquisition – how much it costs to acquire a customer. The lower the CPA, the better. Typically compared against the customer life time value (LTV)
- Virality / Referrals – The % of customers who refer a friend. One way to grow your business is through referrals. Measure how many people are recommending and sharing your product
- Life time value (LTV) – the value of a customer of their lifetime. A baseline metric that all consumer facing products should measure to understand how much value is derived from a customer
2. Ecommerce metrics
One of the primary goals of Product Managers working on ecommerce products is to help their business sell as many products as possible whilst reducing friction, encouraging referrals and delivering a seamless end to end experience that leads to that customer to want to buy again. It sounds like a lot to juggle. It is.
Here’s some key metrics that matter to ecommerce product managers. As with all these metrics, these are by no means exhaustive or essential; just a list of some of the most common and useful metrics for you and your team.
- Orders – The number of orders sold in a given time period. Running an ecommerce business is all about the orders, baby.
- Average order value – The average monetary value of 1 order (what the user has in their basket). Gives you a snapshot of order values which can be used in projections and updating your stakeholders / investors. Enables you to assess and project revenue based on visitor numbers
- Shopping cart abandonment– Number of users who have filled a cart with items but haven’t reached the checkout. It’s fairly self explanatory. If people abandon their baskets, you’re losing revenue. You need to a) try and figure out why and b) put together some experiment ideas for increasing it.
- Checkout abandonment rateNumber of users who have filled a cart, reached the checkout but not completed the purchase Is there something confusing about your checkout process? If customers are putting stuff in their basket and dropping off before checking out, what’s occurring? Measuring this helps you to run experiments to address this.
- Product searches– The number of times a user searched for a product in a set time period. Measure how engaged users are e.g. if you’re selling train tickets, a search is a vital part of the funnel. Discover what users are searching for.
- Average shipping costs– How much are customers paying on average on shipping? Allows you to factor in delivery into pricing models. What is the point at which delivery becomes prohibitively expensive so as to prevent sales? Can delivery costs be used as a lever for driving conversion i.e. offering free delivery over a specific threshold?
- Repeat customers – The % of customers who are repeat customers where repeat customers means they have placed at least 1 order in the past. Single purchase customers are not good news for your life time value or your cost per acquisition. Allows you to measure the health of your LTV and CPAs.
- Revenue – Total revenue for set time period. Without revenue you don’t have an e-commerce business.
- Visits – A unique visitor to your site. Self explanatory baseline metric
- Visit to sale conversion %– The % of all visitors who make a purchase. The visit to sale conversion gives you a healthy overall conversion % benchmark to play with. If you work on a large e-commerce site this will best be split into categories, else it doesn’t make much sense to provide an overall average if you sell thousands of products.
- Shipping time– The time it takes to deliver an item from order date to delivery date (excl. bank holidays / weekends). Shipping is increasingly important to ecommerce companies. Efficient shipping drives conversion.
- Cost per acquisition (CPA)– How much it costs to acquire a customer. If your average order value is $50 but you spend $80 to acquire a customer, things don’t look pretty. But bear in mind the LTV; if the LTV is higher than the CPA, that makes things healthier. In ecommerce profitability is tough since you’re selling physical goods – either through a vertically integrated model or wholesale model – each with their own margins.
- Customer life time value– The value of a customer of their lifetime. Compare your LTV against your CPA for a true test of profitability per customer.
- Mailing list effectiveness– The effectiveness of your mailing list, as defined by you. Measure how effective your email marketing list is in driving sales and return visits to your site. Open rate, click through rate and sales conversion may make up the funnel of your mailing list effectiveness
- Virality– The number of referrals. Monitor how referrals are helping your product to grow
3. API products
We often forget that there are entire products which exist primarily through APIs. Companies like Twilio, Stripe, Shipwire and Shopify all deliver some of their most cherished value through their external APIs and they have APIs to thank for at least some of their success.
But how do you measure your API product as a product manager? Metrics for APIs don’t spring to the mind as naturally as perhaps subscription or ecommerce products do; we’re used to hearing about CPAs and LTV but API products are a peculiar category.
Here’s some metrics to take a look at.
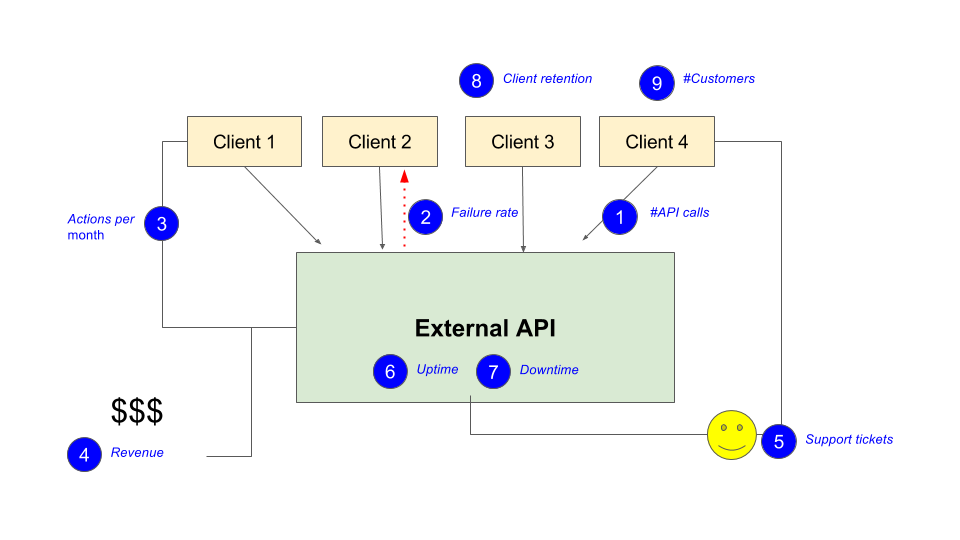
- API calls (requests / responses) – total number of API calls in a given time period. Prove that your API is being used. You could call this a vanity metric, but as your usage increases, you’re continually proving to your team, your stakeholders (and potentially your investors) that a) your product is actually being used by real customers and b) that your API is scaling effectively (if the numbers are large enough).
- Failure rate – number of failed API calls. Prove to stakeholders you’re on top of your game. If you track it, you can measure it. If you measure it, you can improve it.What happens if you don’t monitor this? You don’t know how well your API products are performing. Failed API calls might mean missed revenue or dropping your service levels below an agreed rate, resulting in the loss of revenues / clients.
- Actions per month – your API will perform an action e.g. sending a text message, booking a hotel room, playing a music track. Total number of these actions for your product. Measuring API calls is helpful but defining explicit actions is better. APIs can perform meaningful actions, which result in revenue or engagement. Demonstrate to your stakeholders the value of your by explicitly showing the actions performed by the API.
- Revenue – revenues as a direct result of your API product. Actions can be linked to revenue. Put a $ figure against a set of API calls / actions and suddenly the business will perk up its ears.
- Support tickets – number of support tickets raised as a result of API problems. A sense check from your customer service teams to ensure support tickets are manageable. If the number is high, dig into them to find out what’s going on and why.
- Uptime – total uptime for a particular API. Demonstrate that your API is working at scale
- Downtime – total downtime for a specific API – Identify problems and diagnose bottlenecks in your API by measuring down time at specific periods.
- Client retention – month on month retention of external API customers Retention is an indicator of how useful / how much impact on your API is having on your customers business./li>
- Customers – number of external customers using a particular API Customers = revenues = growth = success = happy faces. An external API with zero customers is a sad thing indeed. /li>
4. Content sites
The definition of a content site here is a product whose primary value is generated by the content it produces. The content itself is the reason people come to the site. Typically, the content is text but can include a blend of text, video and audio. This includes larger media sites such as the New York Times, BuzzFeed or The Guardian, but also smaller blogs.
The typical business model of such a content site is to sell advertising on a CPM (cost per thousand) impressions basis. This means that Product Managers on content sites are often working to maximise the number of visits and the revenue generated by those visits either through advertising clicks or orthogonal revenue generating value propositions such as paid for subscriptions (covered here as a separate category).
What should you be measuring on your content site? Here’s a list of some of the metrics:
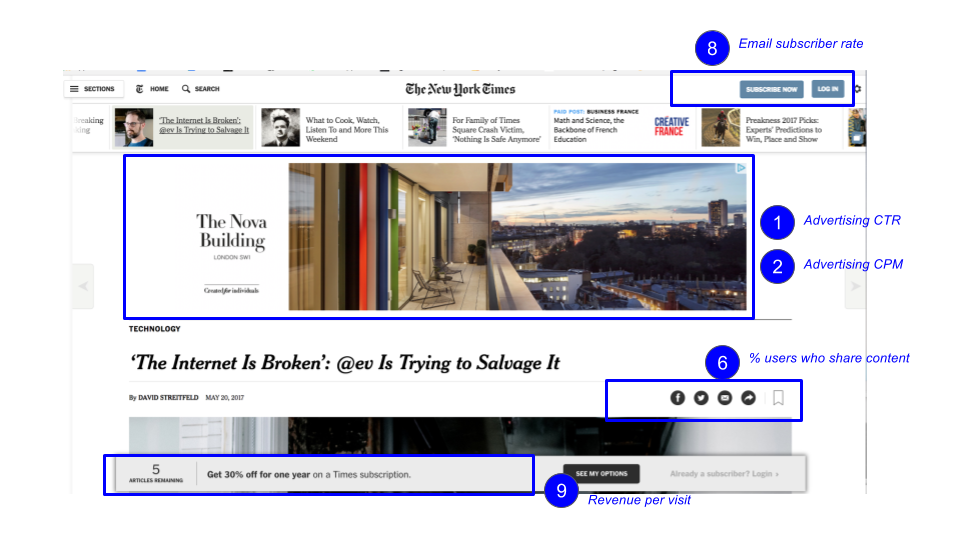
- Advertising click through rate (CTR)-The click through rate of an advertisement running on your content site. Measure how effective advertising formats are across your content site.
- Advertising cost per thousand (CPM)– The cost of an advert running on your content site, sold to the client. CPM = cost per thousand page impressions where M = roman numeral for a thousand. Get a deeper understanding of the business metrics / economics behind your content site if it’s advertising led.
- New vs. returning visits– % split between new visitors and returning visitors. Are visitors coming back to your site? Do you care? Repeat visitors means spending less to acquire new visits and demonstrates long term interest / engagement in your product.
- Bounce rate %– % of visitors who land on your page, click on nothing and leave. Not always helpful and often misunderstood, but particularly useful for measuring the performance of specific landing pages. Looking at a site wide bounce rate isn’t much help.
- Pages viewed per user– Number of pages viewed by 1 user. If your content site is selling ads against impressions, you’ll want impressions to be high – and the average number of pages viewed by a user to be high.
- % of users who share content– % of users who share at least 1 piece of content in a given time period. Content doesn’t have to be shared. If your growth plan is built upon viral growth, this is a key metric, if it isn’t, it’s not as important. Content sites should focus on building content for their users and not dupe them into sharing stuff for the sake of it.
- Most viewed content– Your most viewed piece of content over a specific time period Some content sites can get a major % of their traffic from 1 post alone. Segmenting your traffic by posts allows you to see what your most viewed post / content is. You could make product decisions based upon this. For example, if you know 80% of your visits from Australia are interested in 1 post, you could promote an upcoming Austrlia event on that page.
- Email subscriber rate %– % of total visitors who sign up for an email newsletter. Overall visit to email sign up can be an indicator of a) how relevant your content is to your audience and b) how effective your newsletter / email offering is. Running experiments will help you to monitor this metric.
- Revenue per visit– Amount of revenue generated per visitor. Helps to formulate revenue projections for your business plans.
5. Subscription / software as a service (SAAS) products
Do you remember that weird subscription box craze? Step 1 was to pick the most incredibly niche niche you could think of, step 2 was to turn it into a physical subscription box and step 3 was to watch the dollars roll in. It worked for some businesses (Graze, Dollar Shave Club spring to mind) but not so well for others.
Whilst that trend feels as though it’s (thankfully) well and truly over, subscriptions as a business model are still maturing and evolving, with the current generation of consumers feeling increasingly comfortable paying a small fee in return for access to a product or service ( Netflix, Spotify, NYTimes). It took the Napster generation a little while longer to wean ourselves off the imperfect, illegal world of BitTorrents and mp3s, but much of that was because:
- We’d become addicted to breaking the law and getting whatever content we wanted, whenever we wanted
- There were no genuinely decent paid for services to replace the all you can eat illegal options we’d become so used to
With offerings now available at low, fair prices, the market has shifted from ‘why would I pay for a legal, inferior experience? You’re not having my cash’ to ‘$7.99 for free delivery, video streaming and unlimited kindle books is worth the price – take my cash’.
Product Managers working on subscription / SAAS products have plenty of metrics to measure. It’s perhaps one of the most dynamic, interesting product types to work with from a metrics perspective at least, because you can view the entire customer lifecycle from end to end over a period of a few weeks or months. This is extremely satisfying as a product manager. You can analyse the entire lifecycle, implement some changes and measure the impact of these changes across a whole new set of cohorts.
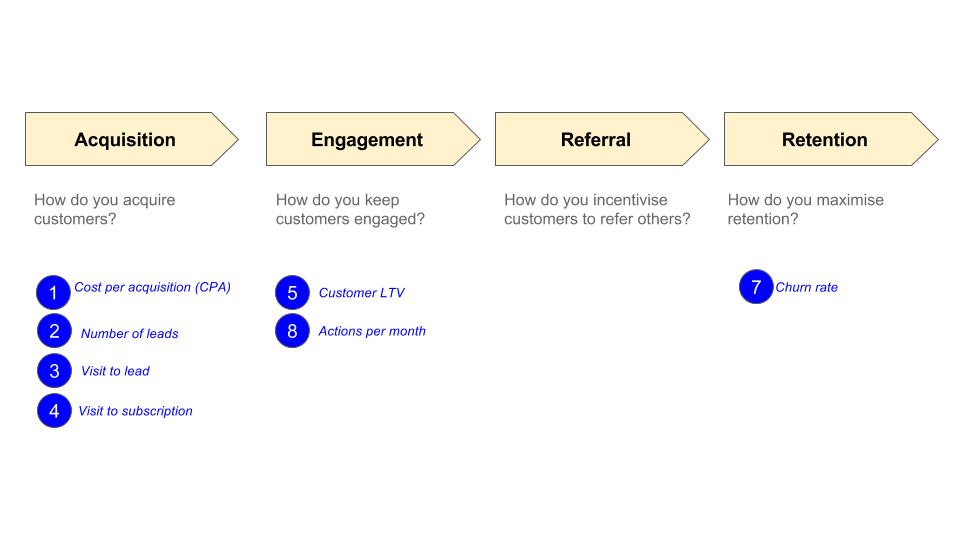
A typical subscription lifecycle might include the following stages:
- Acquisition – how do you acquire customers?
- Engagement – how do you keep customers engaged and using our product?
- Referral – how do you incentivise existing customers to refer other customers to increase engagement?
- Retention – how can you use retention tactics to prevent your customers from cancelling their subscription?
Here’s some of the most useful metrics to know as a subscription product manager.
- Cost per acquisition – Cost for acquiring a new paying subscriber. It’s a beautiful thing to acquire customers with zero marketing costs. Rarely does it happen – so it’s best to keep track of it. Your CPA should be below your LTV to factor in other costs. Some suggest around 1/3 of your LTV
- Leads -The number of leads where leads is defined by you / your business. Monitor the people interested in your product. Leads may be: people who have downloaded an e-book, an email subscriber, someone who has requested more information or something else. Agree to a definition of a lead and monitor the number to measure your performance.
- Visit to lead % – The % of your visitors who become leads. Gives you a flavour of how well your marketing channels are targeted to specific audiences. Helps you measure the potency of your sign up forms / process
- Visit to subscription – the % of your visitors who become subscribers/. Get a sense of how willing your audience is to pay for your product. Can be monitored and fed back to your marketing teams or analysed on a campaign specific level.
- Lifetime value of a subscriber The amount of revenue 1 subscriber brings to the business. LTV gives you a sense of long term health of your product and how engaged your customers are over period of time. LTV is linked to your CPA. If you’re acquiring customers at a cost of $500 and your LTV is $400, your microeconomics are not working. You’ll need to work to increase LTV and decrease CPA at the same time.
- Subscription package breakdown – Identify which packages are more popular. Explore bundling opportunities by combining 2 or more packages together.
- Churn rate – The % of customers who leave your product / cancel their subscription e.g. in month 1 you have 100 subscribers and in month 2 you have 95 of those subscribers remaining. Your churn rate is 5%. Your retention is the opposite of churn. In this case it would be 95%
- Measure the long term health of your subscription product
- Measure happiness of your customers
- Calculate customer life time value
- Identify problems which may have contributed to churn
- Actions per month – Number of actions per month (where action is relevant for your product). You can define what your actions are based on the function of your product. Users will derive value from your subscription product which will typically be based upon a set of actions. Examples could include: printing labels, attending classes, listening to songs, viewing movies, downloading books. Monitoring actions allows you to monitor engagement and build rich sets of data about your users.
- % Activations – the number of people who have ‘activated’ their subscription where ‘activate’ is defined by your product. In subscription products, activate could mean many things. If you offer a trial of your product, activate may mean ‘to become a paying customer’.
- % Active users – the number of people actively using your product where you define what ‘active’ means. Measure the engagement of your subscribers. Pre-empt cancellations by tracking lapsed users. Build mechanisms to increase engagement
- Monthly recurring revenue – the amount of revenue your product generates on a monthly basis. Monthly revenue is critical for all products and businesses, but since the subscription / SAAS business model is based upon paying customers, your monthly revenue is particularly pertinent in this case.
6. Mobile apps
The mobile app is dead, apparently. Less and less people are using new apps and we have certainly been experiencing app fatigue. It’s a tough task to get an app off the ground.
If you are going to do it you’ll probably need:
- A shed load of funding and above the line marketing (if you’re a startup)
- A pre-existing brand to use as a launch pad
- A smart grip on the growth metrics that will get you off the ground
Here’s some of the metrics that matter most to product managers working in mobile:
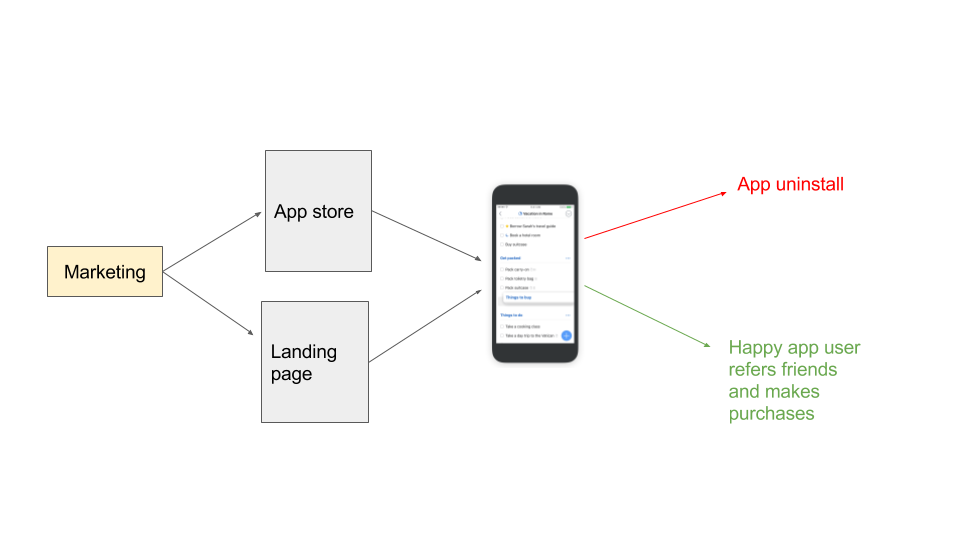
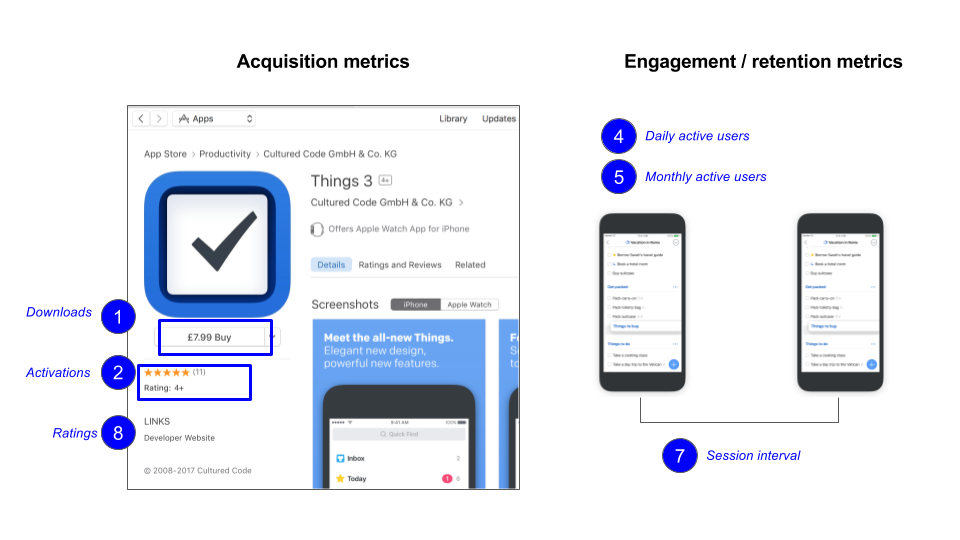
- Downloads– The number of downloads of your app.
- Activations– The number of people who have ‘activated’ your app where activate is defined by you. Activation can be defined as different things for different products.
- Uninstalls– The number of people who have uninstalled your app. Monitor uninstallations to understand how many users are waving goodbye each month
- Daily active users– Number of users who are using your product on a daily basis. Keep on top of your most important numbers.
- Monthly active usersNumber of users who are using your product on a monthly. Keep on top of your most important numbers
- Session length– The length of a session where session is defined as time between app open and app close. Gives you a sense of how engaged your users are. Generally, the higher the session length, the better. However, an app which anticipates a user’s need and ensures a speedy transaction would mean less time spent with the app but a happier user who is more likely to return. An example could be a flight booking app. Your goal could be to reduce session time and increase transactions at the same time.
- Session intervalthe time gap between the last app open and the next app open. Gives you an insight into how ‘sticky’ your app is
- Ratings– Your app’s ratings in the app store (typically a star rating). Less stars reduces the likelihood of your app being downloaded.
- In-app purchases– The number of in-app purchases made. Measure purchases and revenues to project the current and future financial projects.
7. Lead generation sites
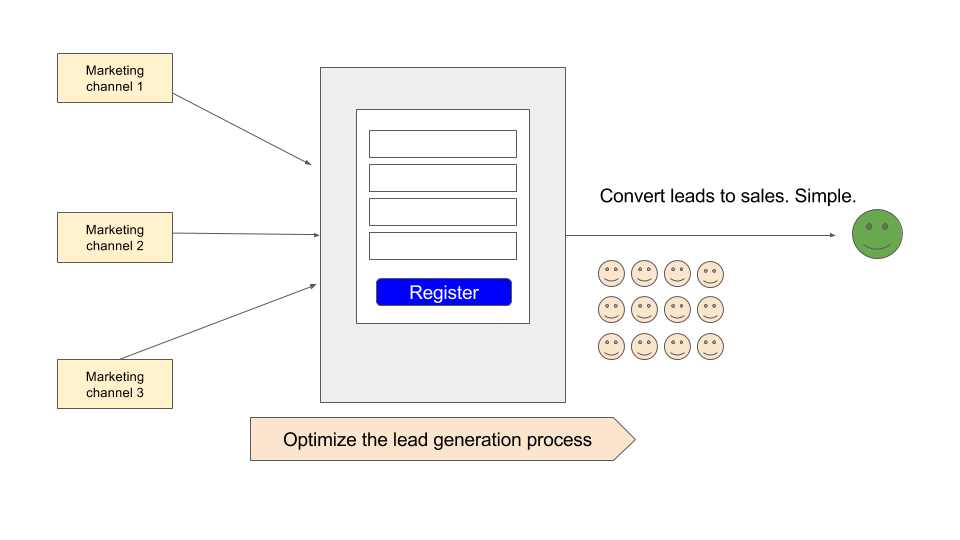
Many product management roles are focused exclusively on lead generation and conversion rate optimization – and not building the next iPhone and becoming Steve Jobs, as many product gurus would have you believe. Lead generation and conversion rate optimization sound pretty dull but can often be satisfying.
Watching your metrics shift and knowing that your metrics are having a profound impact on the business and the bottom line can be highly rewarding. A small % shift across large lead gen sites can mean big differences throughout the end to end funnel.
Here’s some of the metrics you should be measuring on your lead generation website if you’re a product person focused on lead generation:
- Leads to customers ratio – % of leads who become customers. Helps you to determine if your leads are qualified and if your product meets their needs. If this is low, ask your leads why they don’t want your product. Factor the qualitative analysis into your plans.
- Bounce rate % – % of visitors who land on your page, click on nothing and leave. Lead gen sites need high conversion to lead. Bounce rates should be measured per landing page.
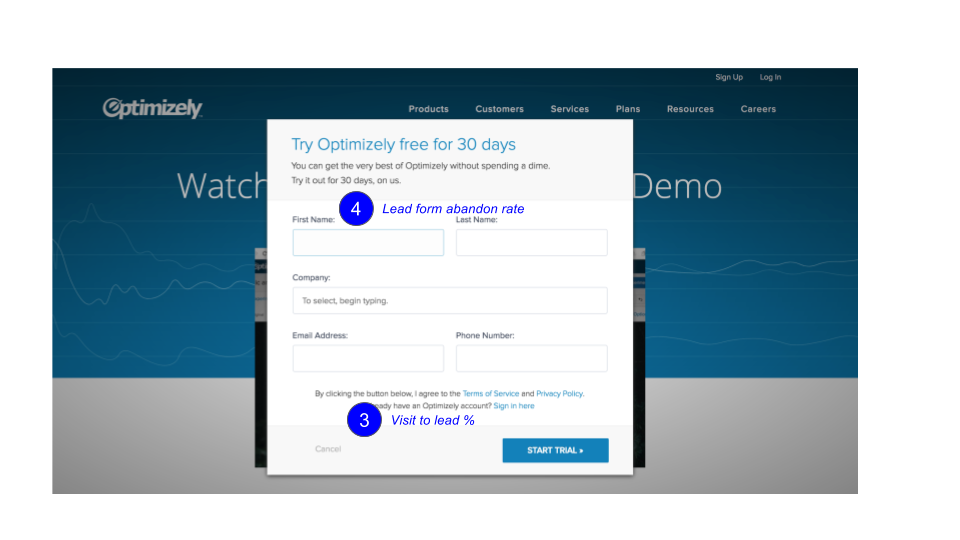
- Visit to lead % – The % of visitors who become leads. Gives you a flavour of how well your marketing channels are targeted to specific audiences. Helps you measure the potency of your sign up forms / process.
- Lead form abandonment rate– the % of visitors who start to fill in a form and abandon it. Helps to identify flaws in your sign up / lead gen process
- Content downloads/requests– the number of people who have downloaded some content e.g. a free e-book.
- Qualified leads/requests – number of qualified leads where qualified leads is defined by you. ‘Qualified’ leads can be determined by your team. It may take some time to understand what ‘qualified’ means. Through experimentation you might discover that ‘qualified’ for your product means over 1) in full time employment, 2) intending to purchase in the next 3 months 3) based in the US. Your product will make its own definition of what qualified means.
- Qualified visits % – what % of your total visits are qualified? Assess the overall quality of your visits. If the qualified visit ratio is low, make changes to attract
- Email subscriber rate % – what % of your total visits are qualified? Assess the overall quality of your visits. If the qualified visit ratio is low, make changes to attract.
- – % of visitors who unsubscribe from your email% of visitors who unsubscribe from your email. Unsubscribes are indicators that: a) your content is not engaging b) you’re pissing people off or c) you’re attracting the wrong audience in your email sign up by either marketing to the wrong people or misrepresenting your offering at the point of sign up. For example, a user may have signed up for a one off ebook – not a weekly email.
- Dwell time – the amount of time a user spends in a single session on average. Dwell time can be an indication of engagement for a landing. Averages can be distorted by one person who leaves the window open on their desktop for 3 days. Dig deeper into the data to find anomalies.
Product launches, news and analysis delivered to your inbox. Weekly.